


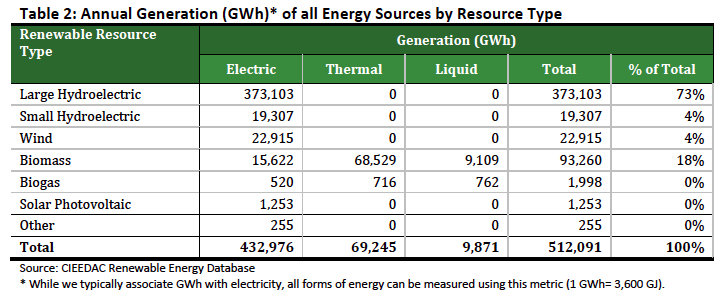
Renewable energy — energy from natural sources that replenish themselves at the same rate they are used — accounted for sixty-seven per cent of Canada’s electricity generation in 2013. Biomass, wind, and solar power nearly made up a quarter of all renewable energy generation (heating, fuels and electricity) in Canada last year.
Unfortunately there is no comparable national data available in Canada from any other year, so it is hard to know just how much Canada's renewable energy sector has grown. The findings for 2013 come from a newly expanded renewable energy database launched earlier this year by the Canadian Industrial Energy End-Use Data Analysis Centre (CIEEDAC), part of Simon Fraser University in Burnaby, BC. It is the first of its kind in Canada.*
“Financial analysts, renewable energy developers, policy-makers need solid, reliable and recent data on renewable energy in Canada to know what is happening in the sector,” Dan Woynillowicz policy director at Clean Energy Canada says.
“The irony of Canada calling itself an energy superpower is how difficult it is to get up-to-date accurate data on Canadian energy production here. Some of the better statistics actually come from the U.S.,” Woynillowicz told DeSmog Canada.
The Centre’s Renewable Energy in Canada 2013 report prepared for the Department of Natural Resources admits the database is only an “overview” and much work needs to be done to improve the quality of data it collects:
“Many questions remain about the extent and nature of renewable energy production in Canada. In this regard, a number of opportunities exist to expand and refine the database and analysis,” the report states.
Ontario Leads in Wind and Solar, B.C. in Biomass, Nova Scotia in Tidal
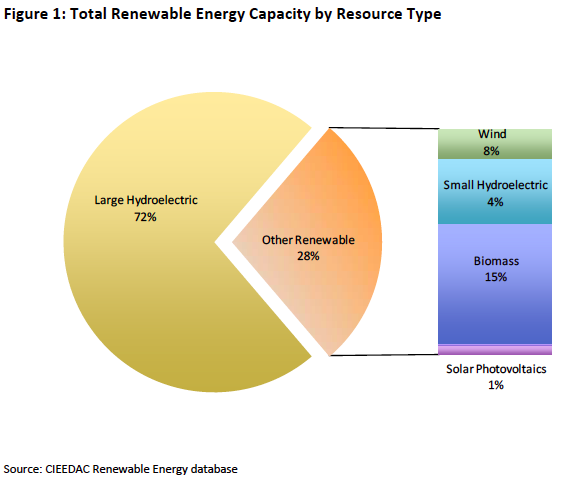
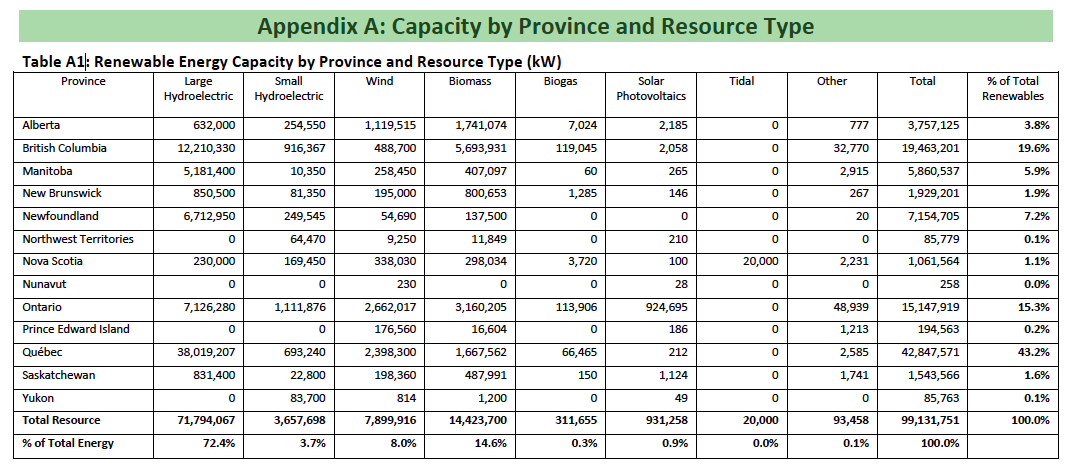
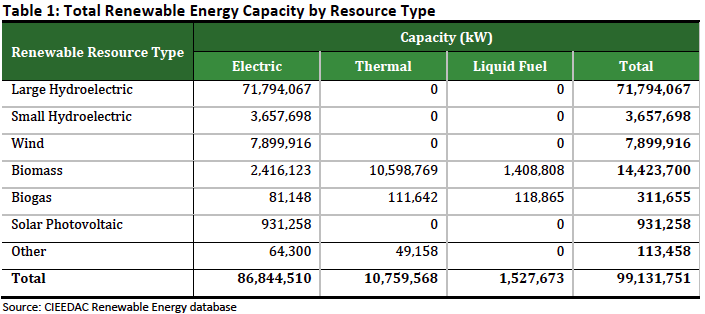
The Centre estimates eleven percent of Canada’s capacity for energy production came from renewable energy last year, and most of this was in electricity generation. The lion’s share of Canada's renewable energy capacity is in waterpower or hydroelectricity — seventy-six per cent — followed by biomass (15 per cent), wind (8 per cent) and solar (1 per cent).
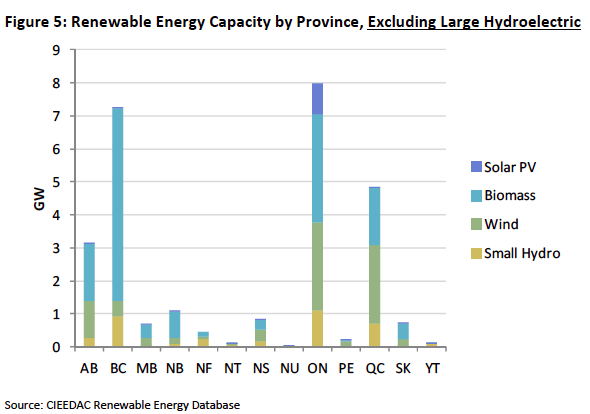
Ninety-nine per cent of Canada’s solar power capacity was constructed in Ontario last year. Ontario led all other provinces in wind power installation ahead of Quebec and Alberta. B.C. was Canada’s number one producer of energy from biomass (mainly wood waste) and Nova Scotia was the only province to build new tidal power facilities on its shores.
The Nightmare of Collecting Data on Canada’s Renewables Industry
The renewable energy sector does not have its own version of the Canadian Association of Petroleum Producers or CAPP, a well-funded private sector-association producing statistics on the oil and gas industry on a regular basis. The creation of the renewables database was only made possible when supporting funds became available through Natural Resources Canada.
An energy analyst trying to get a national picture of Canada’s renewable sector previously had to investigate data produced by the provinces and the limited information provided by Statistics Canada. This data varied in the units of measurement used to calculate energy and time periods analyzed making it all the more difficult to piece together a national mosaic for the renewable energy sector in Canada.
“Its like comparing apples to oranges,” Woynillowicz says from Vancouver.
“The database is a good step forward but it really only scratches the surface,” Woynillowicz told DeSmog Canada.
Professor Michael C. Moore, an energy economist at the University of Calgary published in 2012 his proposal for creating a Canadian version of the U.S. Energy Information Administration. The U.S. agency “collects, analyzes, and disseminates independent and impartial energy information” for the American public and is even used as a source for Canadian energy statistics.
Two years later neither the federal government nor any provincial governments have shown interest moving forward on creating a Canadian Energy Information Organization.
“It’s a thorough, well constructed proposal,” Woynillowicz says of Moore’s proposal.
“The proposed two and a half million dollar a year contribution from the federal government is about one tenth the amount that Natural Resources Canada will spend on advertising over the next two years,” Woynillowicz of Clean Energy Canada told DeSmog.
Canada moved up to fifth place in the world for doing business in the renewable energy sector according to this month’s renewable energy country attractiveness index (RECAI) conducted by Ernst & Young. Ontario’s green energy policy has helped lift Canada’s global clean energy ranking.
The Canadian Industrial Energy End-Use Data Analysis Centre believes its renewable energy database can improve by exploring the economic costs and benefits associated with renewable energy, expanding regional reporting, validating the quality of data coming from renewable facilities and making the database more representative of the diverse sources of energy in the sector.
Maintaining and improving the database will depend on critical funds from Natural Resources Canada, although some concerns have been raised regarding the current federal government's low-priority view of data collection.
* An early version of this article stated the CIEEDAC database was new, rather than recently expanded.
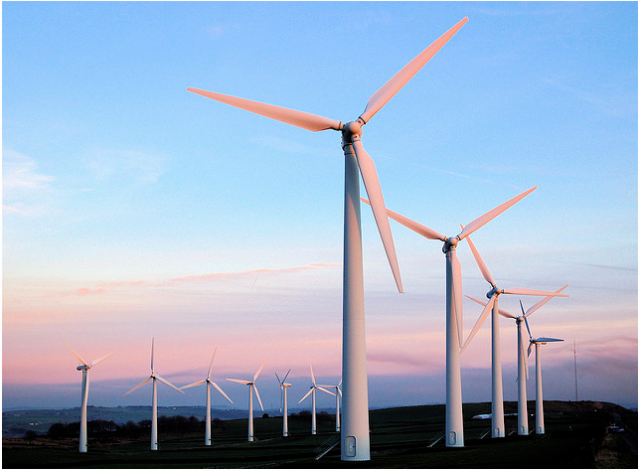
Image Credit: Wind turbines photos by Chris Cook (some rights reserved), all other images provided by the Canadian Industrial Canadian Energy End-Use Data Analysis Centre.