


Intense, fast-spreading fires are an enduring and natural feature of Canadian landscapes, but for most of the past 40 years, relatively few residents were evacuated each year. Yet, in the past 10 years, an unprecedented number of homes have burned in Alberta and British Columbia.
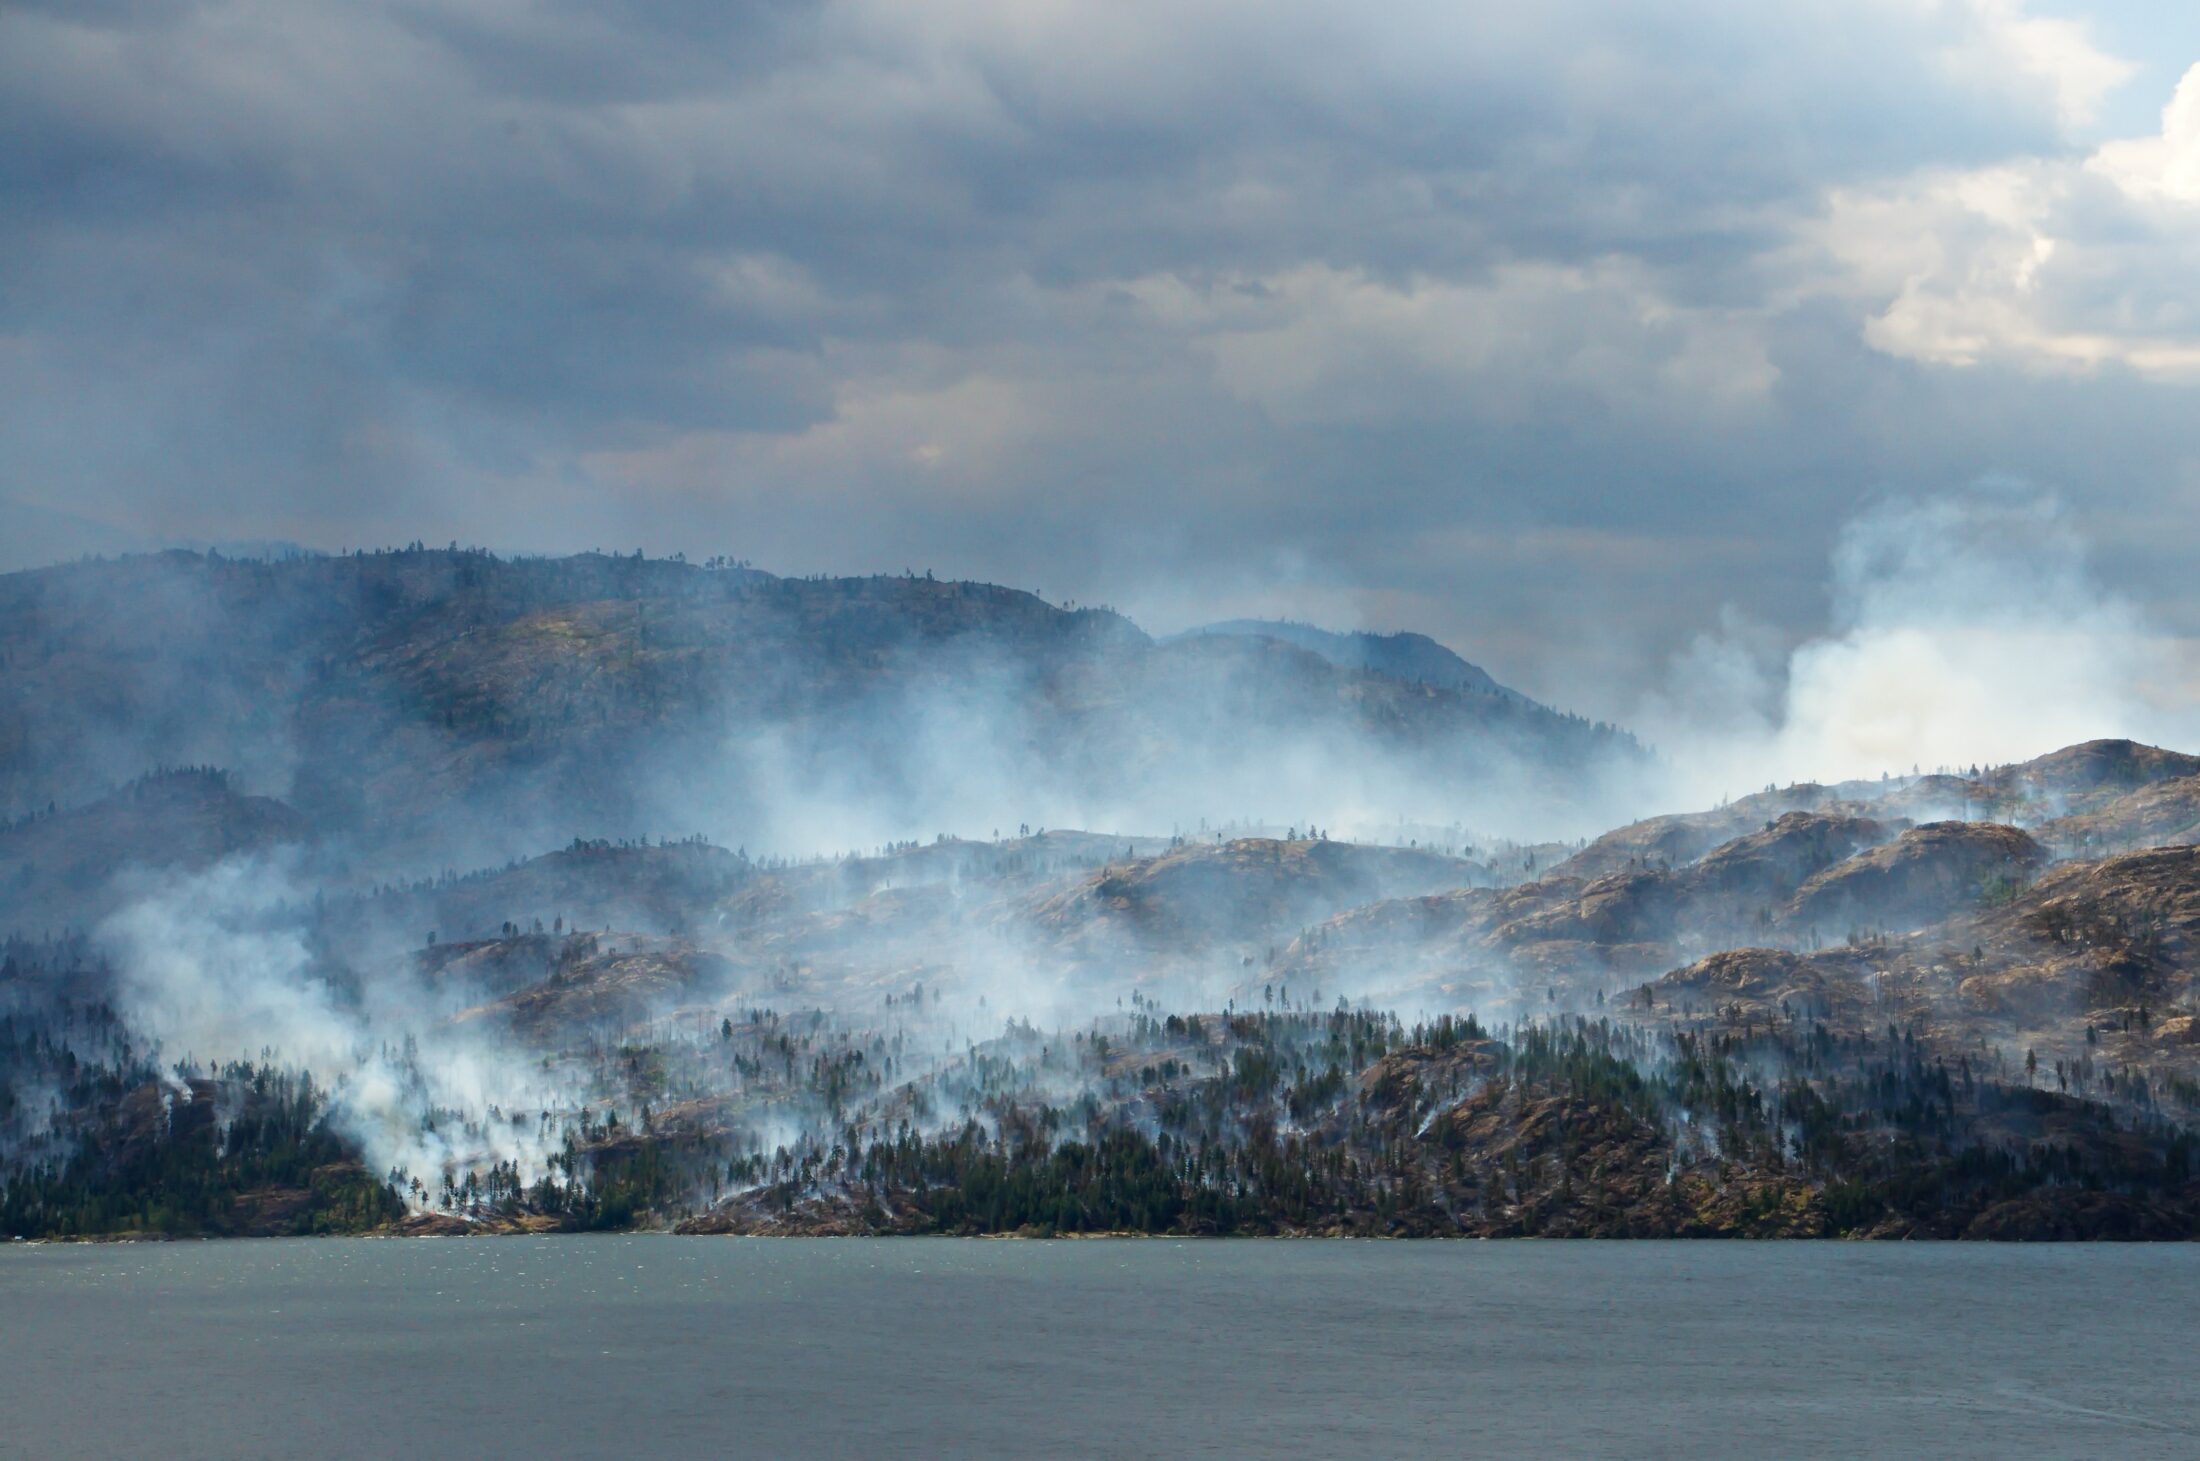
Recently, a wildfire destroyed 90 per cent of Lytton, B.C. Residents had minutes to evacuate as the fire engulfed the village. Slave Lake and Fort McMurray have also suffered enormous losses within the past decade.
As a wildfire scientist, when I look at these disasters I don’t see isolated events, or even a trend, but an abrupt shift to a completely new state. Since 2011, Western Canada has experienced a succession of extreme fire seasons with prolonged threats that affect many communities and last weeks or months.
When I think about what unfolded in Lytton and elsewhere, I am reminded of American business magnate Warren Buffett’s advice on the need to prepare for adversity: “Predicting rain doesn’t count. Building arks does.” For me, this means that efforts to predict fire risk and to prioritize mitigation efforts are not enough. Now is the time to prepare for fire disasters — wherever they are possible — and to start deciding what we will do when they happen.
Evacuations were infrequent, untracked
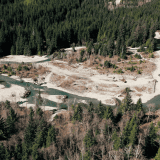
Twenty years ago, there were no national statistics on wildfire evacuations. The 2003 Okanagan Mountain Park Fire that consumed 239 homes in Kelowna, B.C. first exposed how little we knew about the problem. Was it an isolated anomaly or a harbinger of what was to come?
In the years that followed, my colleagues and I began to compile details from newspaper archives and records from emergency response agencies gathered from 1980 to 2007. Overall, evacuations had displaced a relatively small number of Canadians. In more than 25 years, wildfires destroyed 497 homes and prompted evacuation of just 210,000 people, the equivalent of about 18 homes and 7,500 evacuees annually. We confirmed only one civilian fatality.
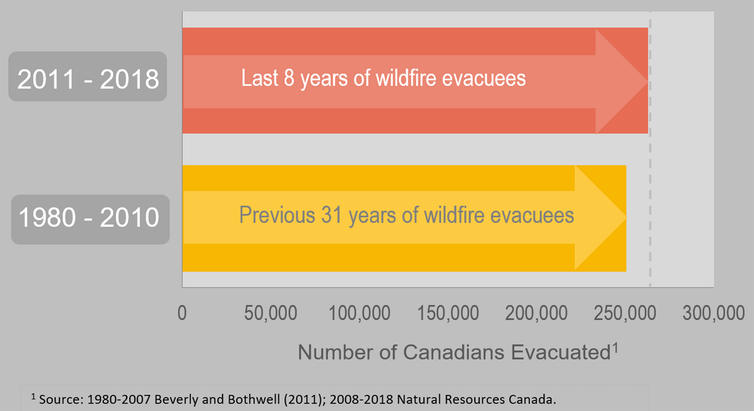
That compares with roughly 3,000 homes lost in Slave Lake in 2011 and Fort McMurray in 2016. Fort McMurray also had 80,000 evacuees in 2016 and B.C. had 65,000 evacuees the following year. In Alberta, 15,000 were evacuated during the spring of 2019 alone.
Analysis of national fire numbers and area burned have revealed statistically significant increasing trends in large parts of Western Canada. Nationally, the largest fires have doubled in size since 1959. We also know that fire seasons are getting longer, with a larger number of days being conducive to the types of fast-spreading, intense fires that can threaten public safety and property.
In recent decades, there has been a surge of research studies that seek to predict how fire regimes — fire frequency, size, intensity, severity and season — can be expected to change in concert with our heating climate. Those studies certainly point to intensification of the kinds of weather extremes that produce wildfire disasters like the recent one in Lytton.
Possible catastrophes need action
Prediction has long been a cornerstone of fire research and fire management. We study the data and build complex models to identify which areas are most likely to burn today, tomorrow, this year and in the years to come. This information can help decision makers prioritize limited fire suppression resources and mitigation budgets, such as those allocated for FireSmart fuel reduction treatments.
Early in my career, I used complex computer simulation models to try to map the locations most likely to burn in the next or several years. But when we looked at where the real fires occurred in the years that followed, we discovered that most fires consumed areas assessed as having a relatively low likelihood of burning.
No matter how sophisticated, fire risk assessments are riddled with uncertainties and crippled by the inherent variability and the random nature — referred to as stochasticity — that accompany fires, weather and fuel at play.
Governments can prioritize the most at-risk communities in a region and allocate mitigation funds to the top 20, but the next disaster could very well hit community No. 21. When conditions are extreme, like the 60 km/h winds reported in Lytton, FireSmart fuel reduction treatments cannot be relied upon to protect a community from an encroaching fire.
The evacuation records taught us that these events often unfold under highly atypical conditions such as extreme wind speeds that would be ignored in risk assessments based on what is most likely. In short, if it’s possible for an area to burn at all, then you need to plan for it.
Take what you know and plan what you’ll do
So what do we know for certain? Fuels are the hazard or precondition necessary for fire, and we know where the fuels are. In this context, fuels are live and dead biomass or vegetation. We can map the fuel hazard and identify which locations of a community or landscape is exposed to potential ignitions.
This simple approach led to the creation of the FireSmart Exposure Assessment tool for informing community protection planning, and we’ve recently shown that it works for assessing large landscapes too.
My research team is currently extending that work to map potential fire pathways into communities, and in collaboration with transportation engineer Amy Kim and her students, we’re asking how the flow of fire into a community could disrupt the flow of people evacuating the area.

Our aim is to develop simple and easily computed metrics of fire exposure, fire pathways and evacuation routes to inform what-if scenarios. Agencies and communities can use these to understand vulnerabilities and develop proactive strategies for mitigation, response, containment and evacuation.
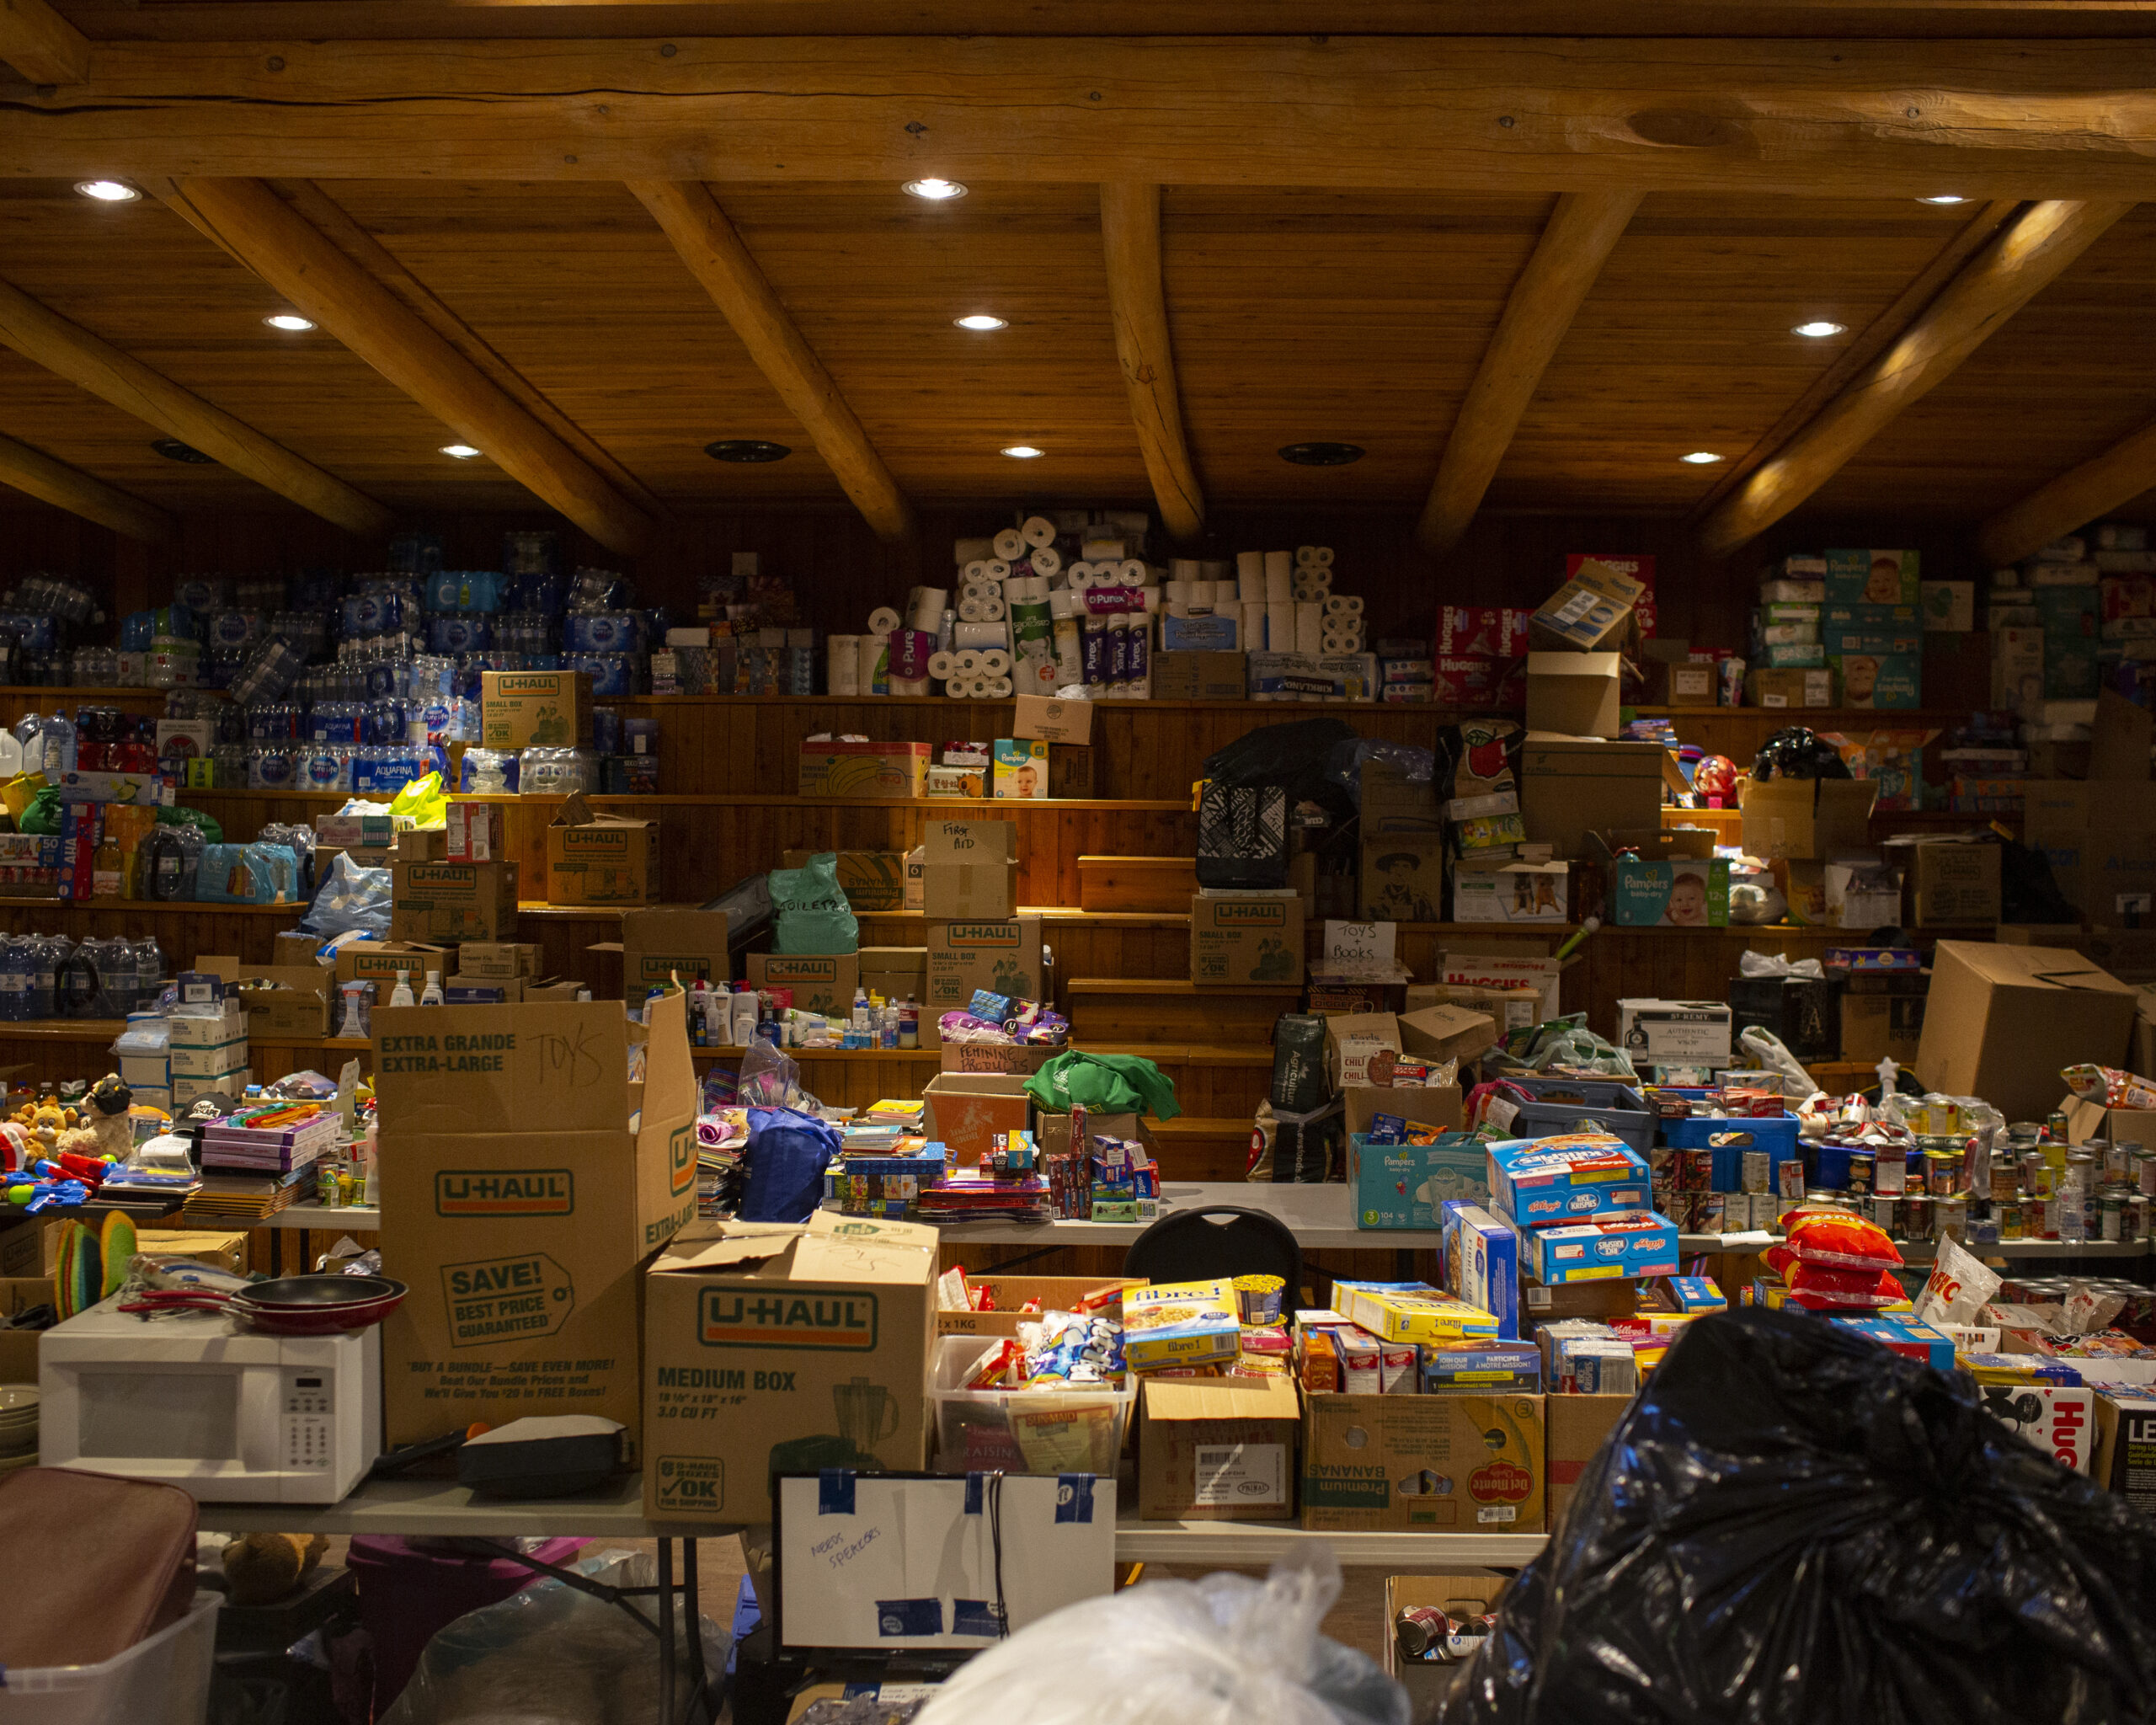
Science can inform the planning process, but ultimately these efforts will only succeed when solutions are developed locally to capture local circumstances, knowledge and needs. Rather than a burden, planning for fire can be a mechanism for growing local skills and long lasting community connections, by bringing diverse perspectives together around the common goal of a safer and more resilient future.
When it comes to wildfire threats to communities, we are navigating uncharted waters. Under extreme conditions like those across B.C. this summer, we cannot stop a spreading wildfire. When they occur, the only option is to contain it or evacuate. So start planning your route now.