


This story is part of Toronto’s Climate Right Now, a collaboration with The Local about vulnerability and adaptation in Canada’s largest city.
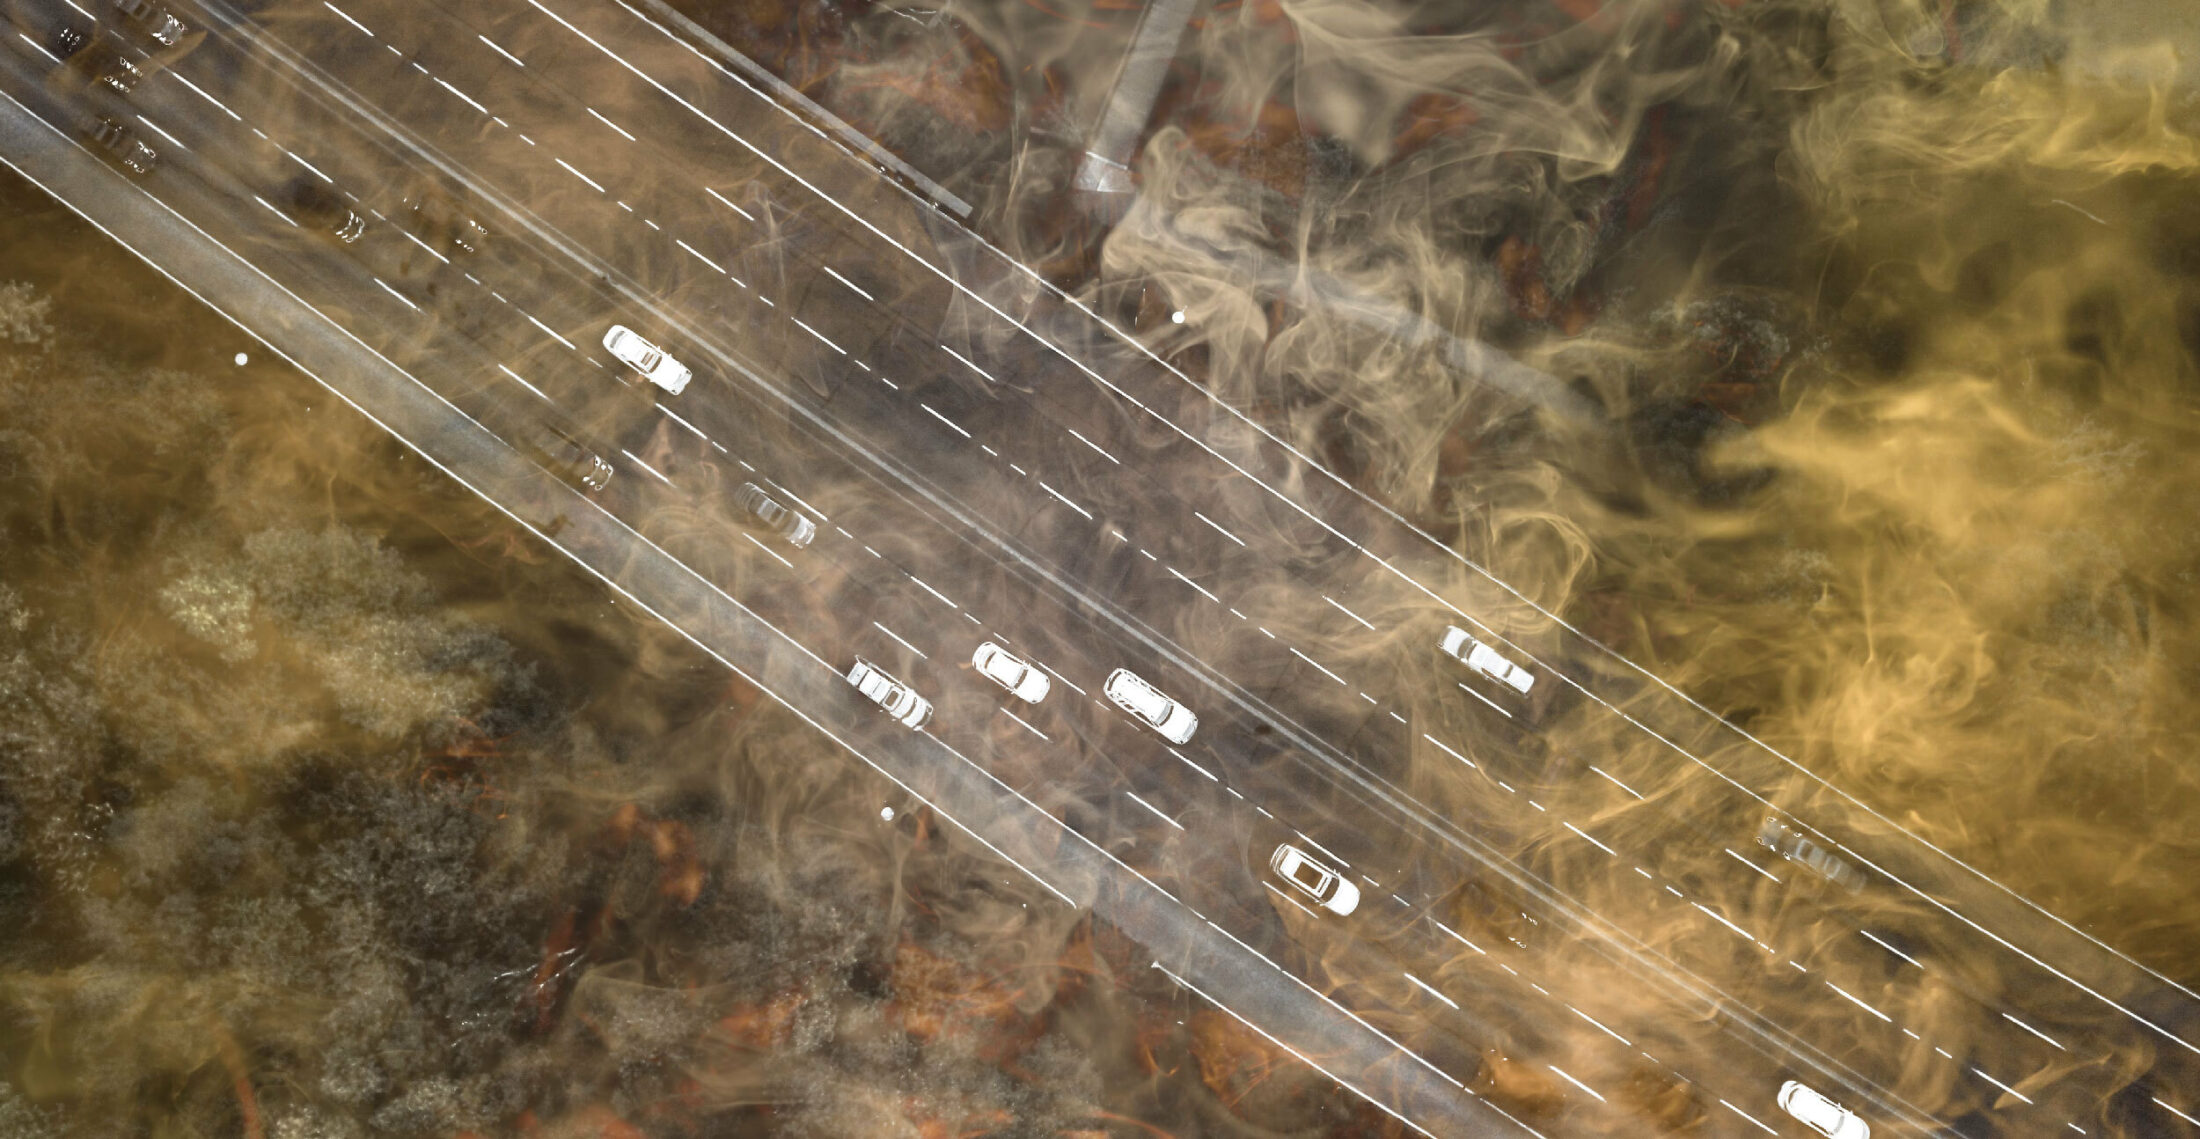
The air pollution flowing from vehicle exhaust pipes and the breakdown of rubber tires hangs over Toronto-area highways like a mostly invisible cloud.
That’s especially true in communities along Highway 401 — the section passing through Toronto is the busiest highway in North America, packed every day with both commuters and commercial trucks. But it applies in other places too. Astride the Gardiner Expressway, mostly bare balconies hang a stone’s throw from the gridlock. And along the Don Valley Parkway, apartment towers overlook rush hour. In many cases, lower income and marginalized communities bear the brunt of the health impacts, ranging from asthma to premature death.
That on its own isn’t a shocking revelation, said Sarah Buchanan, campaigns director at the non-profit Toronto Environmental Alliance. The finding has been confirmed by study after study. The issue is that no one ever seems to do anything about it. There was a flurry of attention around the problem at Toronto City Council in the 2010s, she noted, but it didn’t really go anywhere.
“It seemed like it kind of stalled,” Buchanan said.
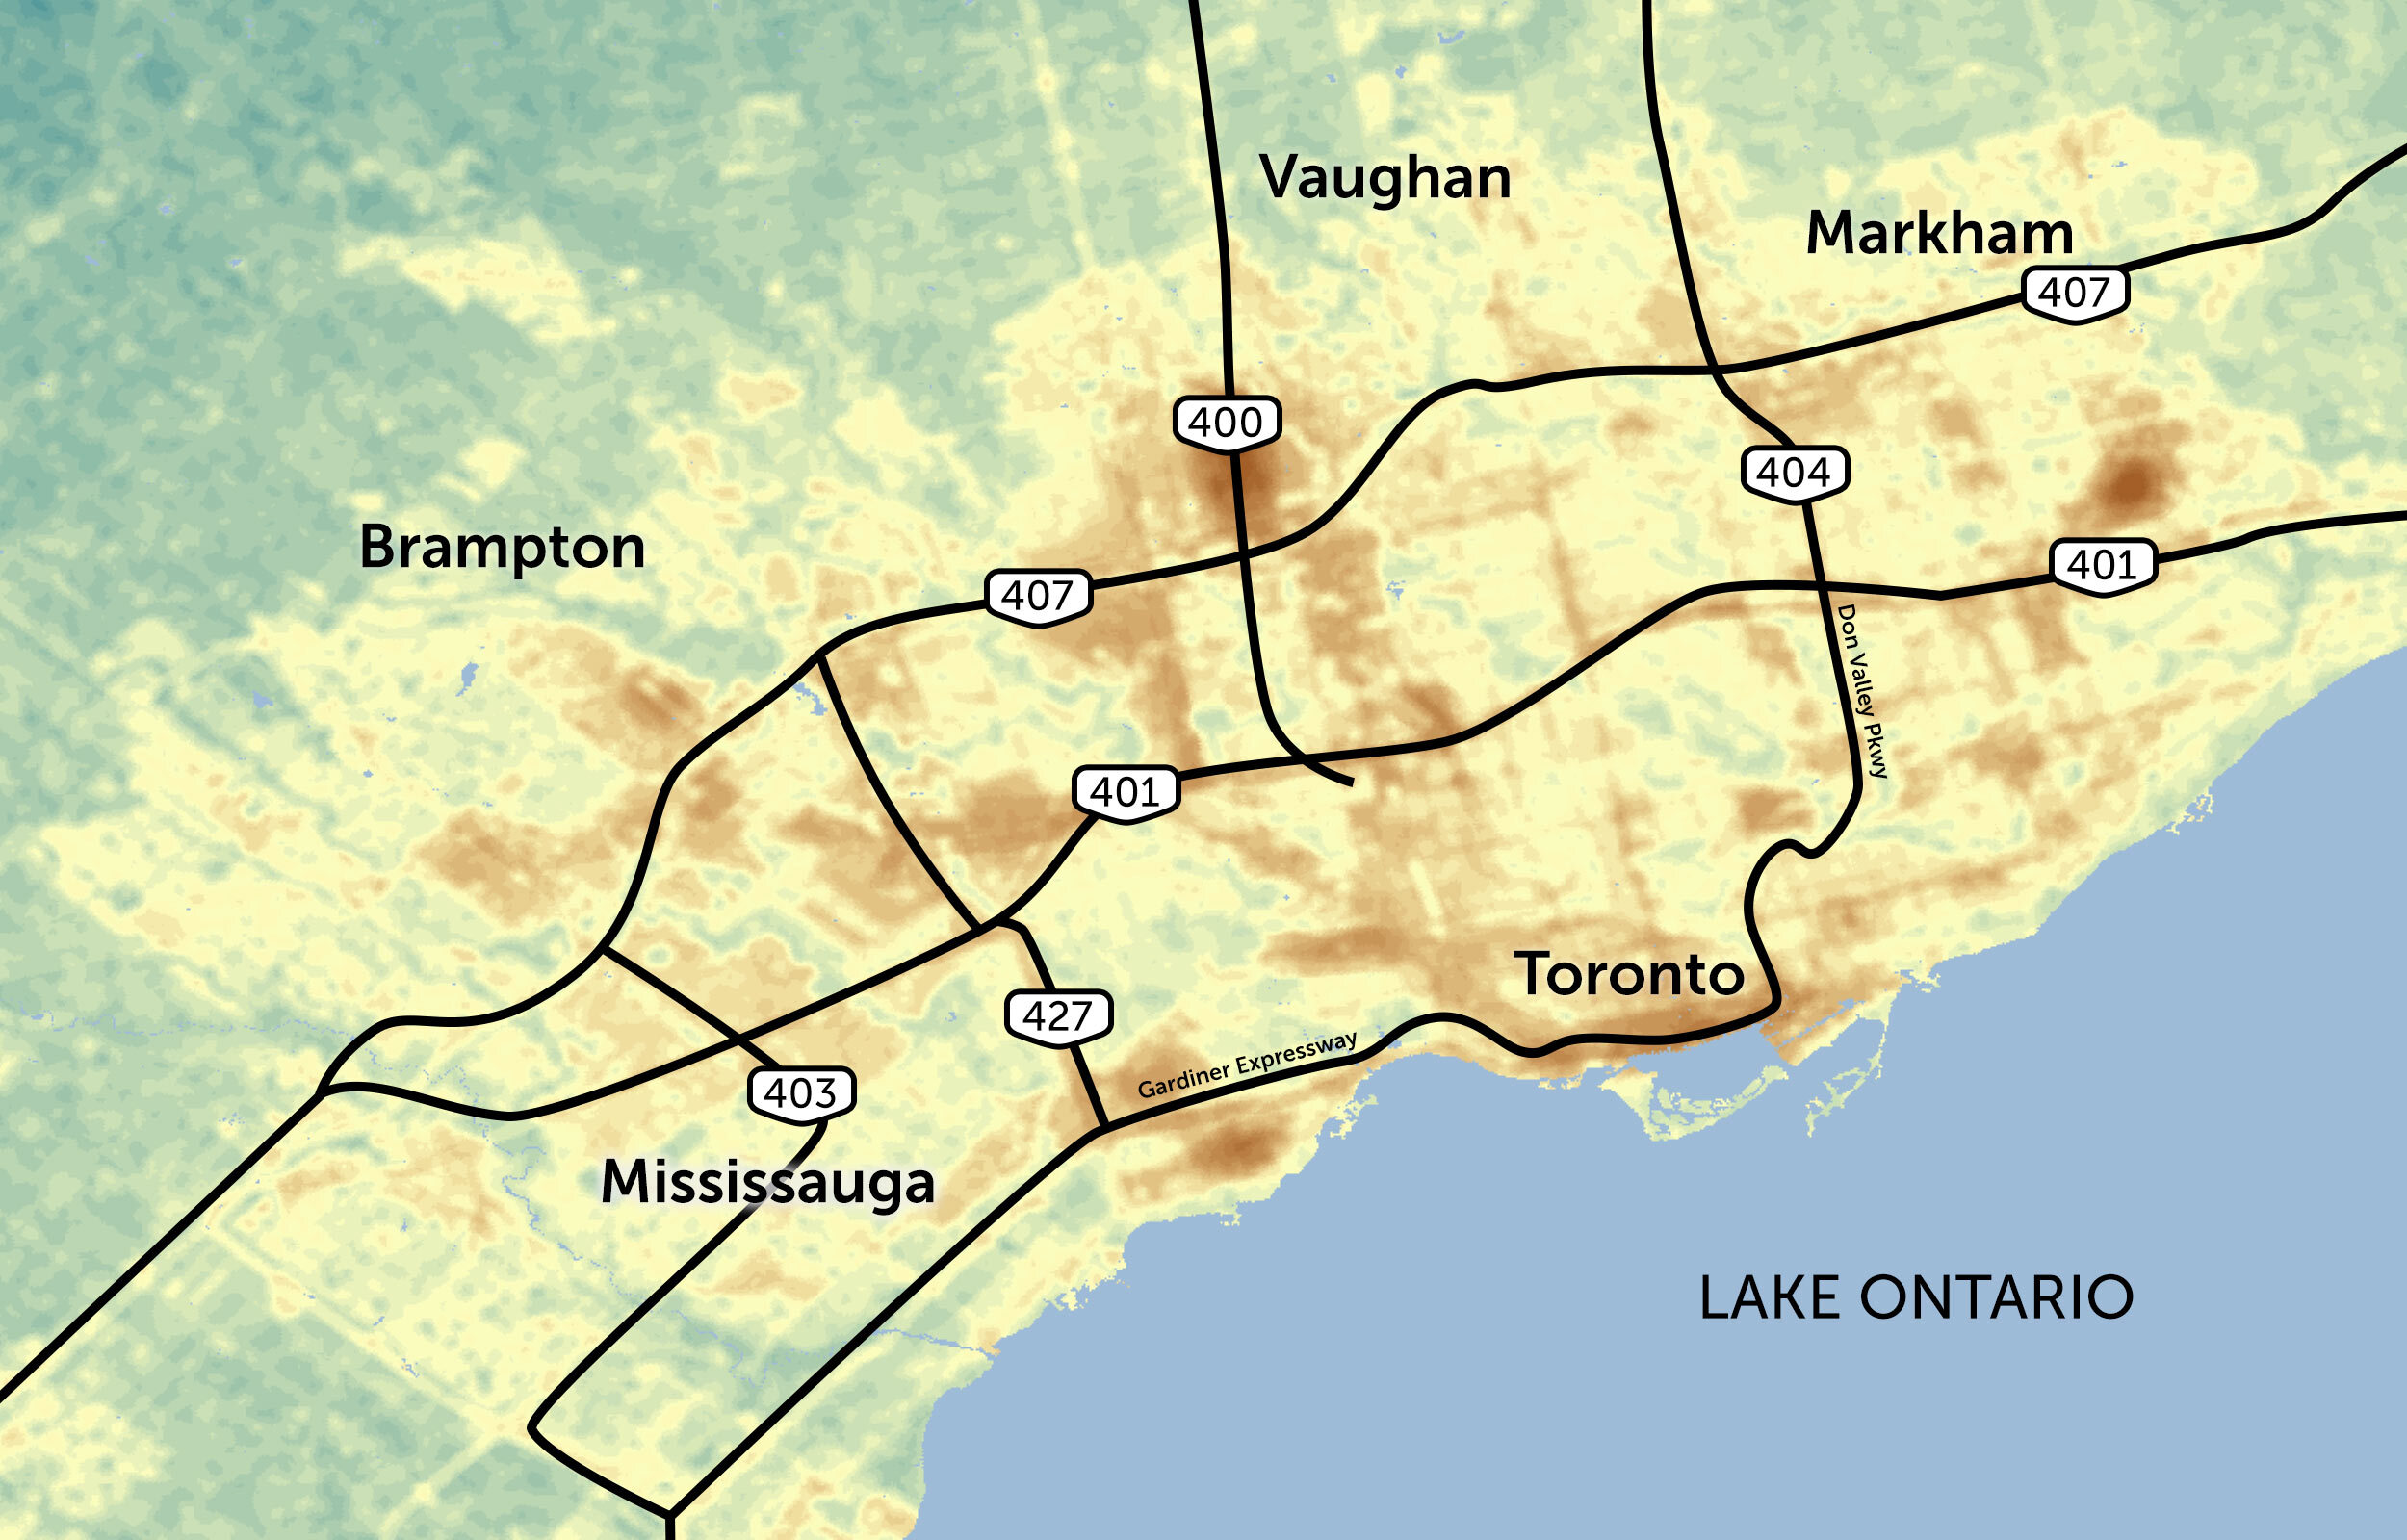
The city’s last report on traffic pollution was published in 2017, full of maps that showed clusters of contaminants outlining the paths of the city’s major highways, particularly the 401. In Weston, in the northwest part of the city, levels of benzene and particulate matter sometimes surpass health guidelines set by the province, the report showed. Aside from downtown Toronto, the biggest hotspots were around the 401, especially where it intersects with other highways.
Two years later, in late 2019, the city held a town hall to explain the findings to residents, generating a few headlines. But a few months later, COVID-19 hit. Public health attention was overwhelmed by the emergency.
“As a result of the pandemic, most public health resources and staff were redeployed to the COVID-19 response and vaccination campaign, including staff who were involved with the [traffic-related air pollution] report,” a Toronto Public Health spokesperson said in an email.
“As we are able to shift resources from the pandemic response to non-COVID-19 public health programs, [Toronto Public Health] will be able to again focus on environmental matters of concern.”
Environmental activists, scientists and public health experts have been pointing to solutions for years. But it’s been difficult to get traffic-related air pollution to be a public priority, said Helen Doyle, the chair of the environmental health working group at the non-profit Ontario Public Health Association. What will it take for decision-makers to act?
“That’s the million-dollar question,” Doyle said.
Information about traffic-related pollution in Toronto ‘needs to get out to the public’
The pollutants at play are often referred to as TRAP, short for traffic-related air pollution. The list includes benzene, which causes cancer, and nitrogen oxides, which can harm the respiratory system and worsen asthma. It also includes a couple of types of particulate matter, a mix of particles that, when inhaled, damage the lungs and are linked to premature death. People can breathe them in near any road with heavy traffic, not just highways. Of course, contaminants found in traffic-related air pollution also contribute to climate change.
As a whole, air quality in Ontario has improved since the province phased out coal-powered electricity, but it still isn’t great everywhere. And for a long time, researchers have recognized a link between road pollution and a variety of health problems — heart and lung conditions, cancer and even some neurological symptoms, Doyle said. That connection is now clearer than ever: in two reports released this past winter, Health Canada found “sufficient evidence” to suggest that exposure to air pollution from traffic causes lung cancer in adults, and likely causes childhood leukemia.
The reports were definitive and specific: traffic pollution caused 170 premature deaths in Toronto in 2015, along with 43 in the neighbouring Region of Peel, one concluded. Nationwide, the issue led to 1,200 premature deaths that year. It caused other health problems too: 3,600 cases of acute bronchitis in children, for example.
Overall, the report attributed $9.5 billion worth of healthcare costs to air pollution from traffic.
“That information needs to get out to the public,” Doyle said. “It needs to get to our decision-makers, and I think we need to have elected officials that take this as a priority.”
And while the pandemic may have pre-empted dealing with Toronto’s air quality problem, science has started to show deeper links between the virus and air pollution. A review of recent scientific literature, authored by the non-profit Canadian Association of Physicians for the Environment and published in April 2022, found that people who are exposed to more air pollution also had a higher risk of contracting and dying from COVID-19.
In a perfect world, the pandemic could have been a prime moment to finally crack down on the pollutants spilling from vehicle tailpipes. For one thing, lockdowns in 2020 temporarily led to cleaner air, as many stayed home and out of their cars, offering us a glimpse of what fresher skies could look like. But rather than capitalize on one of the few silver linings of the crisis, the process of getting back to normal has also meant a return to bumper-to-bumper traffic during rush hour.
This isn’t just a Toronto issue. Depending on weather conditions and the design of roads, people who spend time within 50-to-500 metres of busy thoroughfares are at risk from traffic’s health impacts, according to the Canadian Association of Physicians for the Environment report. About a third of Canadians live within just 250 metres of a major road. A University of Toronto study published in 2018 found air pollution levels were too high near certain roads in Vancouver as well as Toronto.
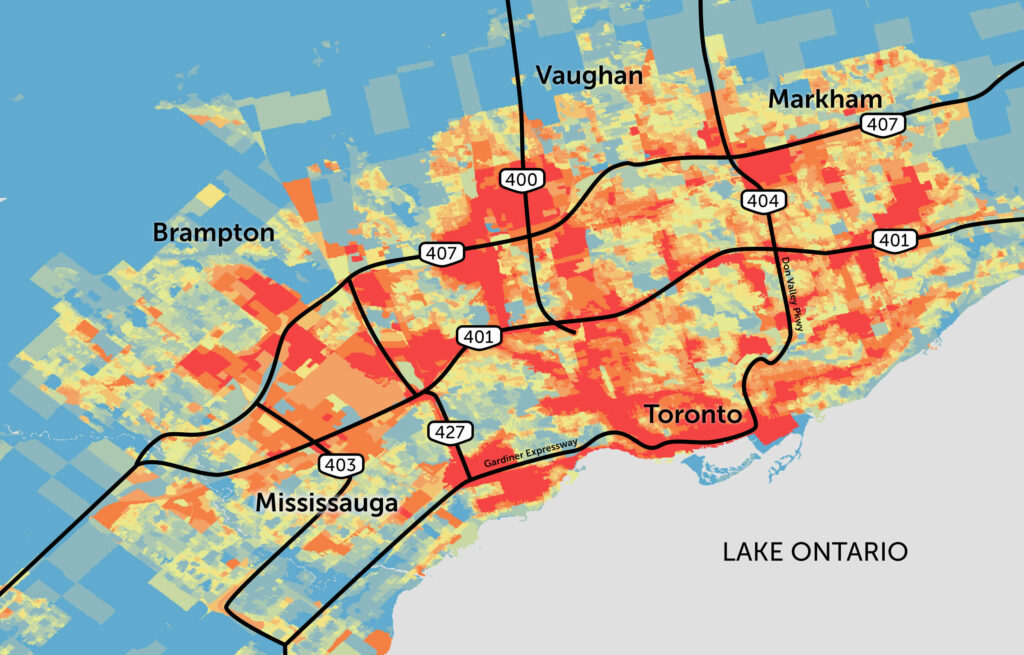
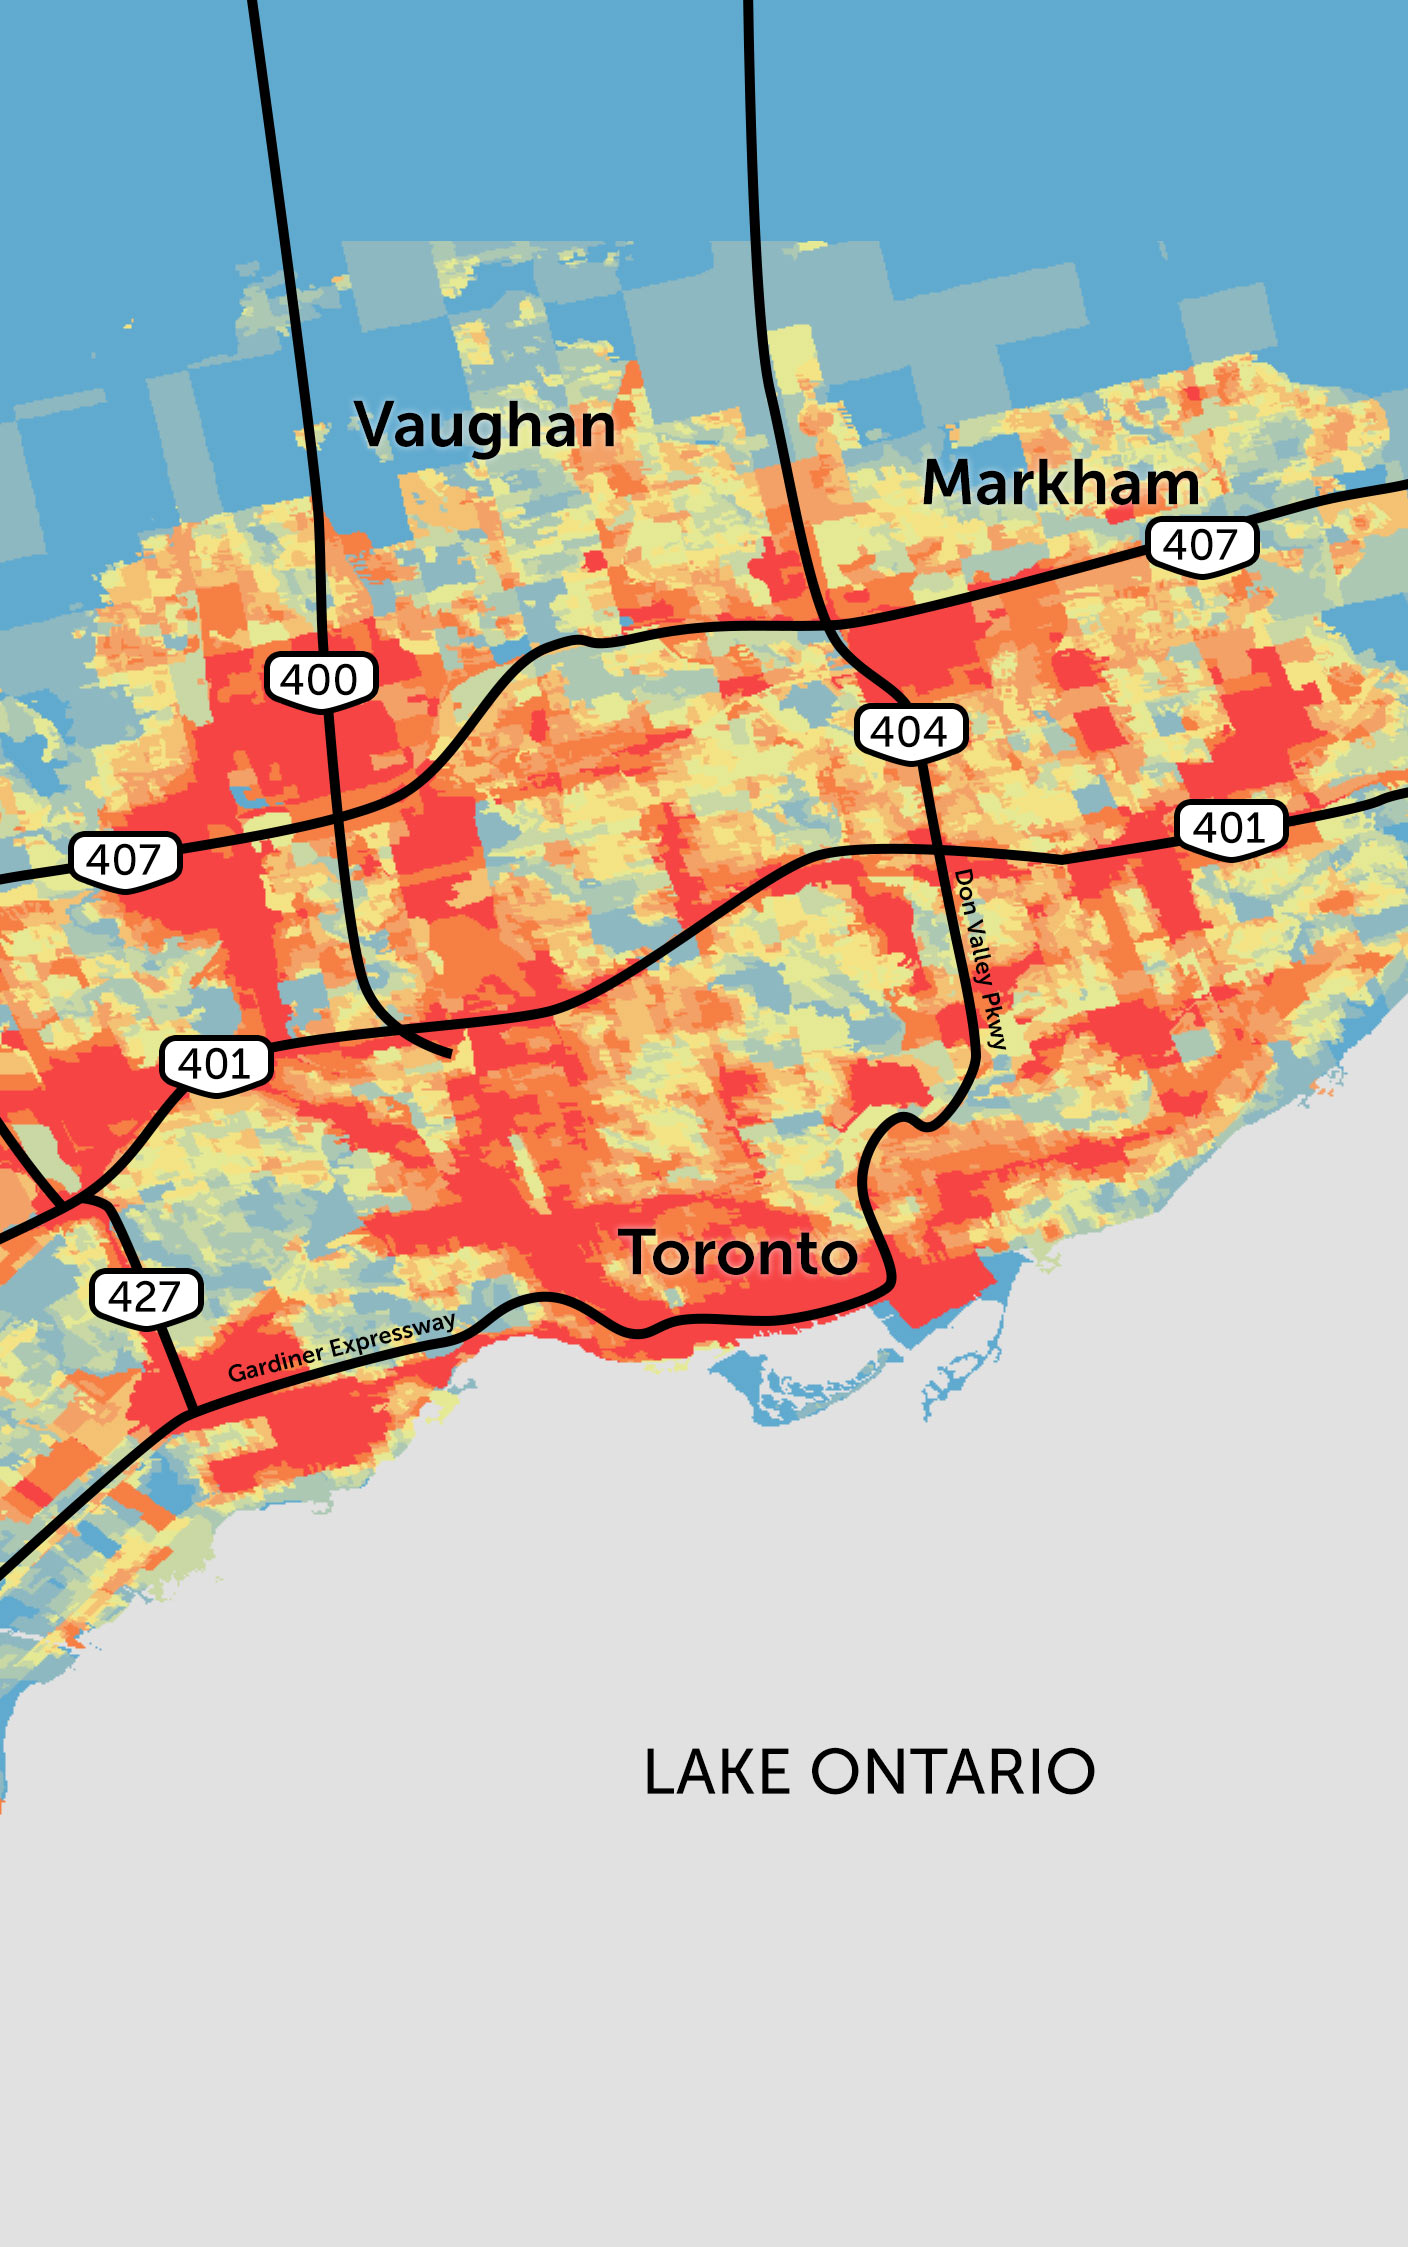
Jeff Brook, an assistant professor at the University of Toronto’s Dalla Lana School of Public Health and department of chemical engineering and applied chemistry, has studied traffic-related air pollution for over 20 years. He is now the principal investigator on a team developing interactive tools that, among other things, allow users to combine air pollution modelled on a map with socioeconomic data from the census. Called HealthyDesign.City, the program’s work, primarily funded by the Public Health Agency of Canada, can be used to identify areas that have both high levels of pollutants and high numbers of people who are lower income and/or racialized.
The air pollution model relies on measurements taken in a variety of areas across Canada. Brook’s researchers used that data to estimate what levels of pollution would likely be in any given place, based on proximity to sources of pollution like traffic.
Versions of this model have been used by scientists since the 2000s, Brook said. It’s imprecise, but can be used to identify areas experiencing long-term exposure to pollution, helping to target further research on health impacts. It can also help people look at patterns and trends, and to compare one location with another. One trend the team has found is obvious clusters of lower income neighbourhoods in pockets with high levels of air pollution.

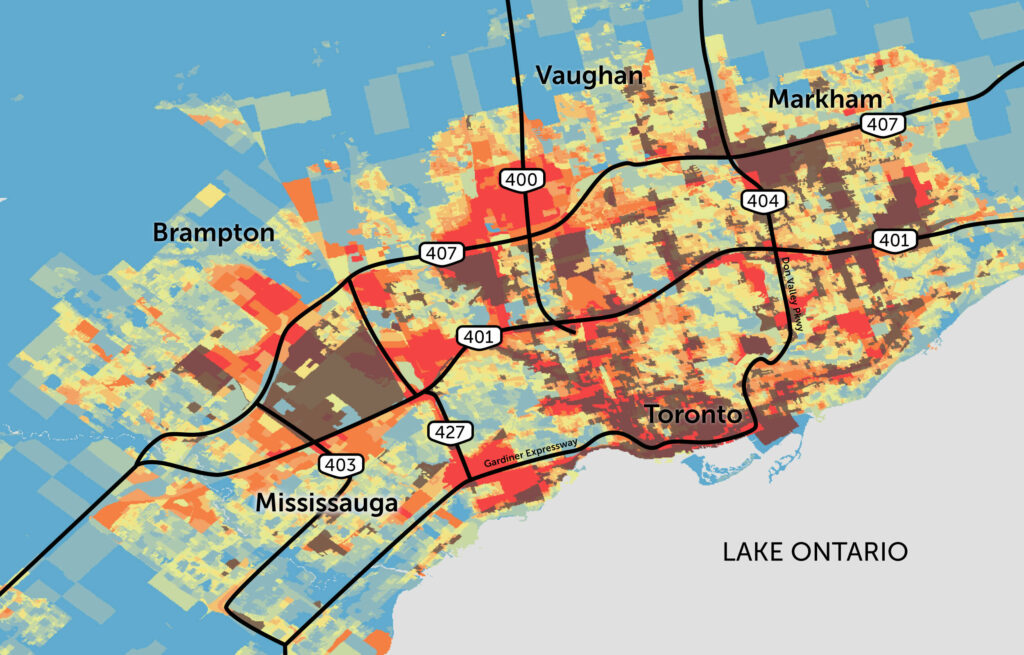
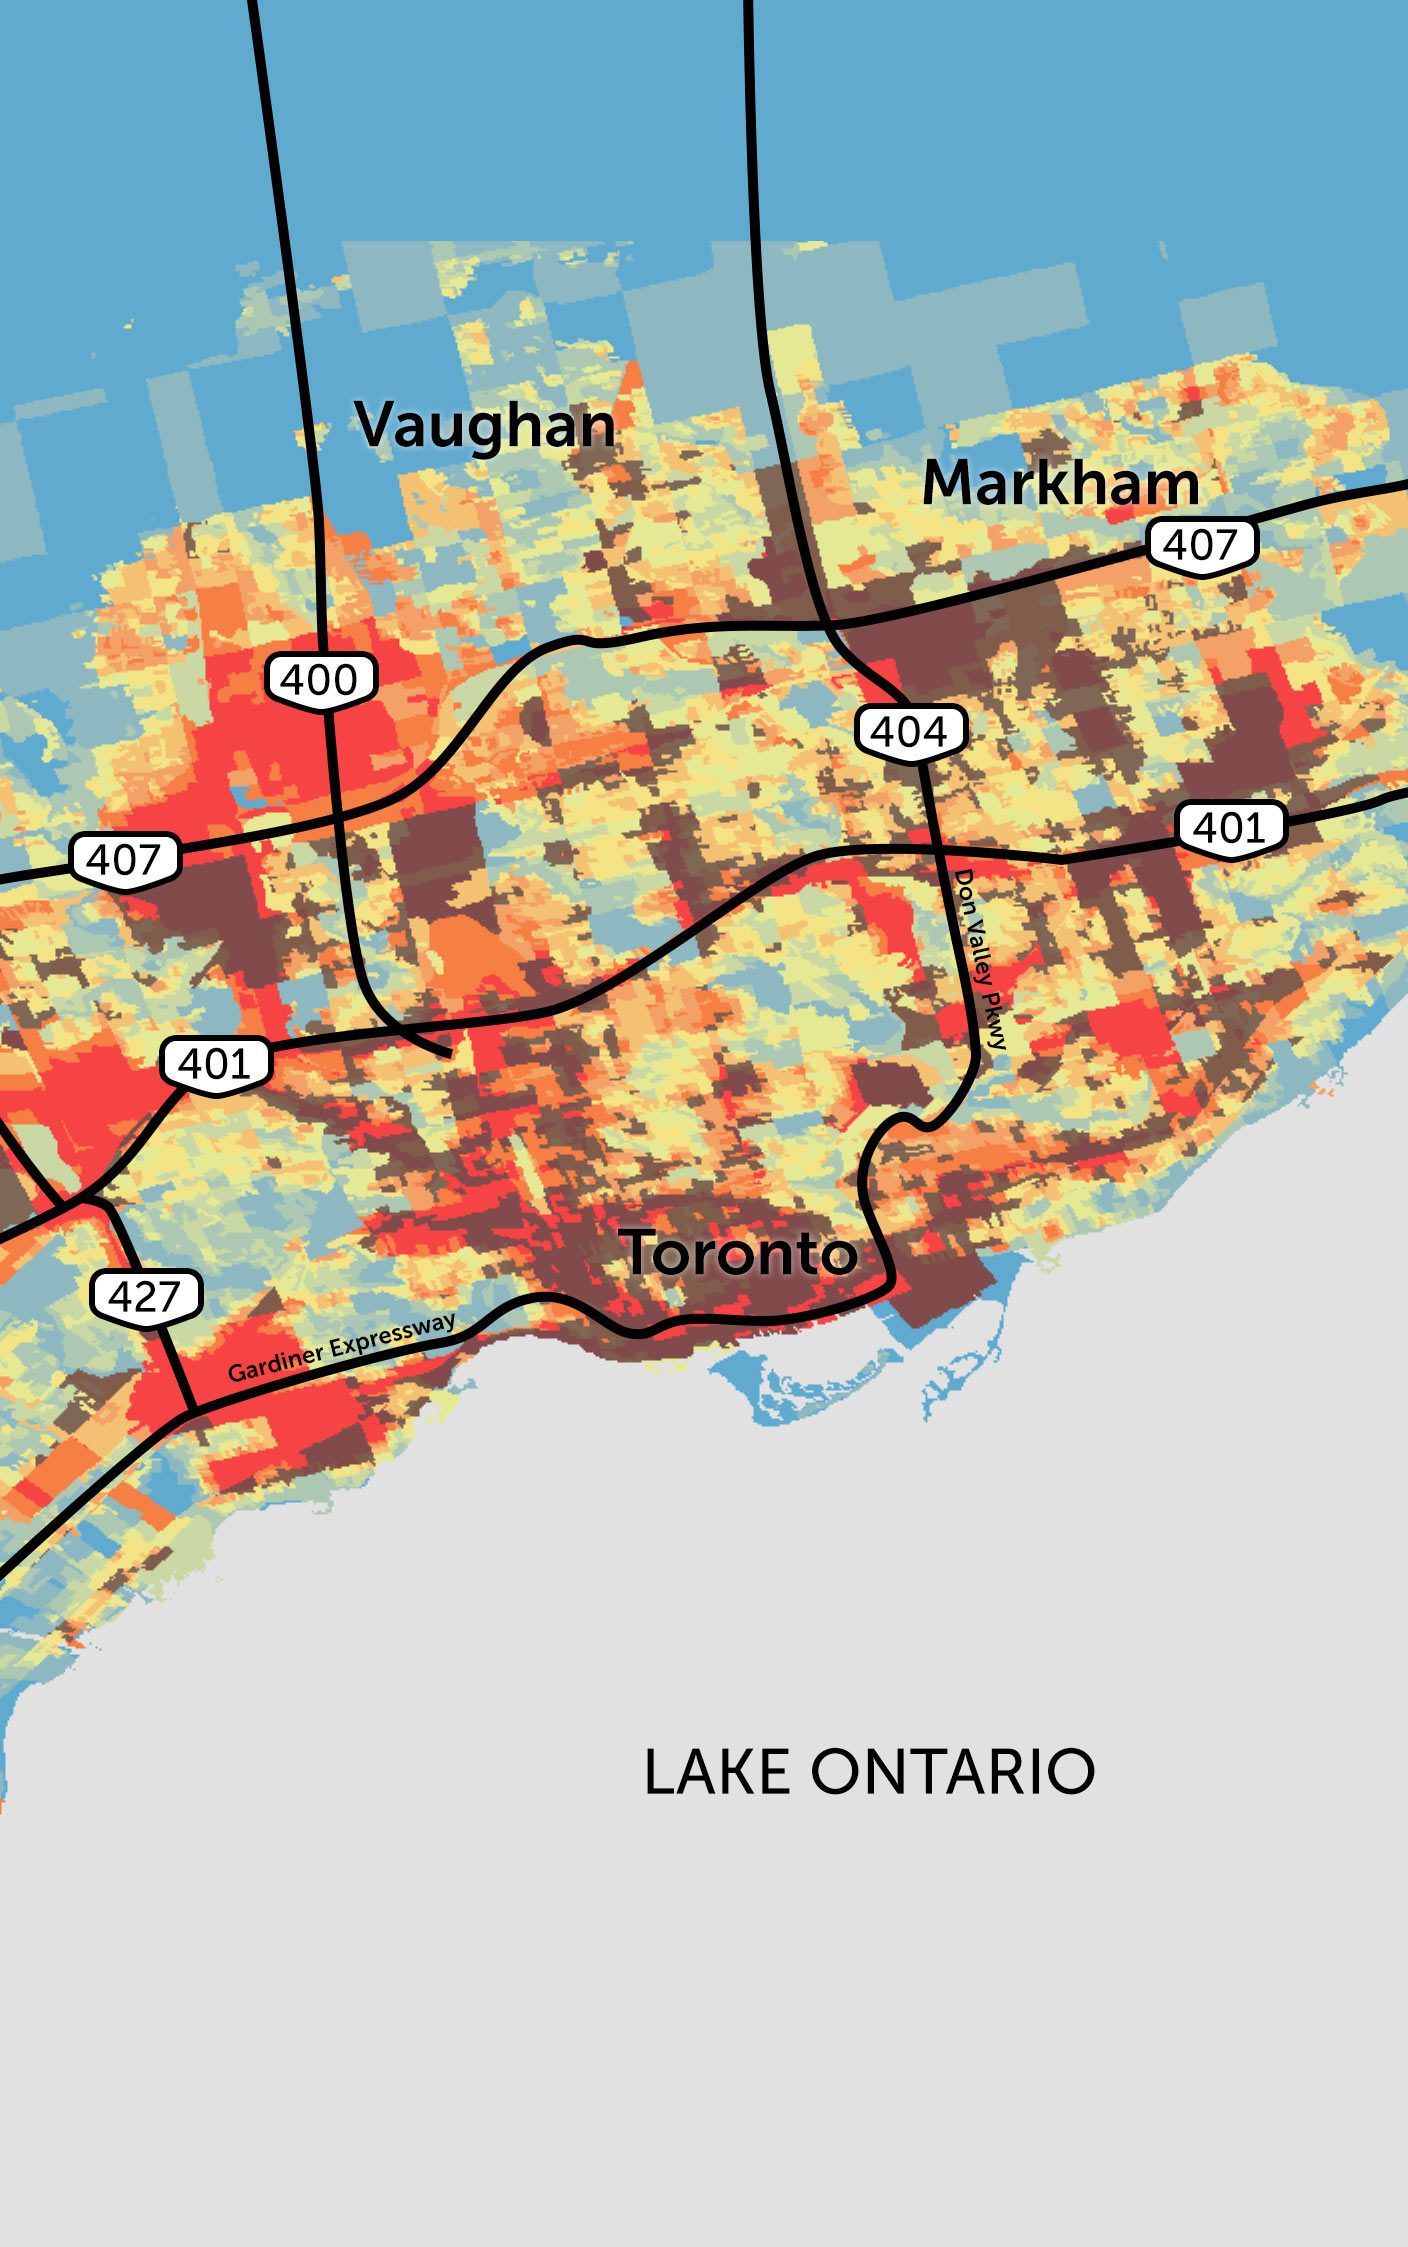
“Likely, areas that are having lots of traffic or traffic noise or traffic air pollution, on balance, tend to have lower property values and lower housing costs,” Brook said in an interview.
“The net result is that people who have lower incomes have the tendency to be in potential areas of higher pollution, and that’s not really a surprise. Anybody who’s got more resources is probably going to choose the area that has more trees and more greenness and more parks, and those are also favourable things for air quality.”
That’s not true in every case, he added — there are some affluent neighbourhoods near highways. Think of fancy waterfront condos by the Gardiner, or sprawling homes in upscale enclaves with easy access to the 401. But in many cases, the places with the most highway pollution tend to be where you’ll find lower income neighbourhoods and immigrant communities. For example, the Jane and Finch neighbourhood, which is tucked in alongside Highway 400 between the 401 and the 407. Or Weston, just south of the 401 by Black Creek Drive.
“We’re not trying to identify areas and stigmatize areas,” Brook said. “It’s more about, well, now that we have this information, we’re empowered to do something about it.”
In Mississauga, Ont., in Peel Region west of Toronto, Rahul Mehta can tell that emissions from idling cars irritate his mild asthma. The founder of the local group Sustainable Mississauga, he bikes and takes transit to get around. But he worries that the lack of fresh air discourages others from ditching their cars, a feedback loop that leads to even more pollution. The suburban city is ringed with highways in all directions, and more major roads stretch in between.
“I’ve felt it’s harder to breathe,” Mehta said. “It’s exhausting to be in that situation. I’m frankly not surprised when people don’t feel like walking and biking is viable.”
How to fix the problem of traffic-related air pollution in Toronto
There’s no shortage of solutions on the table.
For its part, the City of Toronto included seven pages of ideas in the 2017 report. Alongside measures aimed at placing facilities that serve vulnerable groups — like daycares and long-term care homes — further away from highways, staff suggested better traffic management and placing more physical barriers and greenery around highways. Walls can stop pollutants from blowing downwind, while vegetation can intercept harmful particles.

Better air filtration in buildings could be a major help too, the report concluded, and even a portable air purifier can remove “significant levels” of fine particulate matter. In the COVID-19 era, it’s become another intervention that could have multiple benefits.
Some activists are pushing for bigger steps. Replacing fossil fuel-powered vehicles with electric ones would help a lot, Buchanan said, though tires spinning on the road still produce particulate matter.
Swapping out aging fleets of diesel transport trucks could also make a dent. Though diesel trucks make up just 1.5 per cent of the vehicles in Canada, they’re responsible for 80 per cent of traffic-related emissions of particulate matter, the City of Toronto report noted. And the volume of trucks on Ontario highways has ticked up consistently for decades, doubling between 1988 and 2016.
Some steps have been taken to tighten the rules for trucks: Ontario updated its regulations in 2019, mainly cracking down on older diesel trucks. The owners of vehicles that fail emissions tests can receive a fine of $420. The province can also seize their licence plates and order that non-compliant trucks be towed away for repairs.
But more could be done. The technology needed to make electric transport trucks is still in development, but even new fossil fuel-powered transport trucks are significantly cleaner than older models. Brook said governments could incentivize trucking companies to upgrade by subsidizing or providing tax credits for retrofits and new vehicles, and by only granting public contracts to companies using the cleanest technology. That’s been done in California, where lawmakers pushed to cut emissions from freight movement along key corridors in the late 2000s.
“It’s had measurable health benefits,” Brook said of the change. In the years after the change, lower income people with certain chronic breathing conditions who lived near highways went to emergency rooms less often, according to a study published in 2021. “California has done it, we can do it.”
It’s also important that decision-makers here not build any more highways, Buchanan said. The Ontario government is currently seeking to build two, Highway 413 and the Bradford Bypass, through the protected Greenbelt north of Toronto.
“If we have the opportunity to simply not build them, that is the no-brainer solution right there,” she said. It would also help if cities focused on building compact neighbourhoods that encourage people to drive less, she added, instead of sprawling developments that incentivize cars. The Doug Ford government has also eliminated tolls on two Durham Region highways, east of Toronto, a measure that could increase congestion and emissions along with it.
“We need to start investing much, much, much more heavily in ways to get around that don’t use highways and huge vehicles that create all this air pollution,” she said. “Things like better transit.”
Even though reducing pollution from traffic would likely save governments money in the long run by cutting healthcare costs, political decisions are often driven by short-term gain, Brook said. Still, we’ve done it before — as when Canada and the U.S. worked together to pen an agreement in 1991 that drastically cut the emissions that cause acid rain.
Brook said he hopes politicians and citizens can use the tool his team is working on to find places where changes are most urgently needed, and to track progress.
The data — and the solutions — will be there whenever politicians are ready to do something.